


Debugging in VS Code
Every application reaches a point where it’s necessary to understand failures, small to large. In this recipe, we explore a few workflows for VS Code users who would like to debug their application in the browser.
This recipe shows how to debug Vue CLI applications in VS Code as they run in the browser.
Note: This recipe covers Chrome and Firefox. If you know how to setup VS Code debugging with other browsers, please consider sharing your insights (see bottom of the page).
Prerequisites
Make sure you have VS Code and the browser of your choice installed, and the latest version of the corresponding Debugger extension installed and enabled:
Install and create a project with the vue-cli, following the instructions in the Vue CLI Guide. Change into the newly created application directory and open VS Code.
Displaying Source Code in the Browser
Before you can debug your Vue components from VS Code, you need to update the generated Webpack config to build sourcemaps. We do this so that our debugger has a way to map the code within a compressed file back to its position in the original file. This ensures that you can debug an application even after your assets have been optimized by Webpack.
If you use Vue CLI 2, set or update the devtool property inside config/index.js:
|
If you use Vue CLI 3, set or update the devtool property inside vue.config.js:
|
Launching the Application from VS Code
We’re assuming the port to be 8080 here. If it’s not the case (for instance, if 8080 has been taken and Vue CLI automatically picks another port for you), just modify the configuration accordingly.
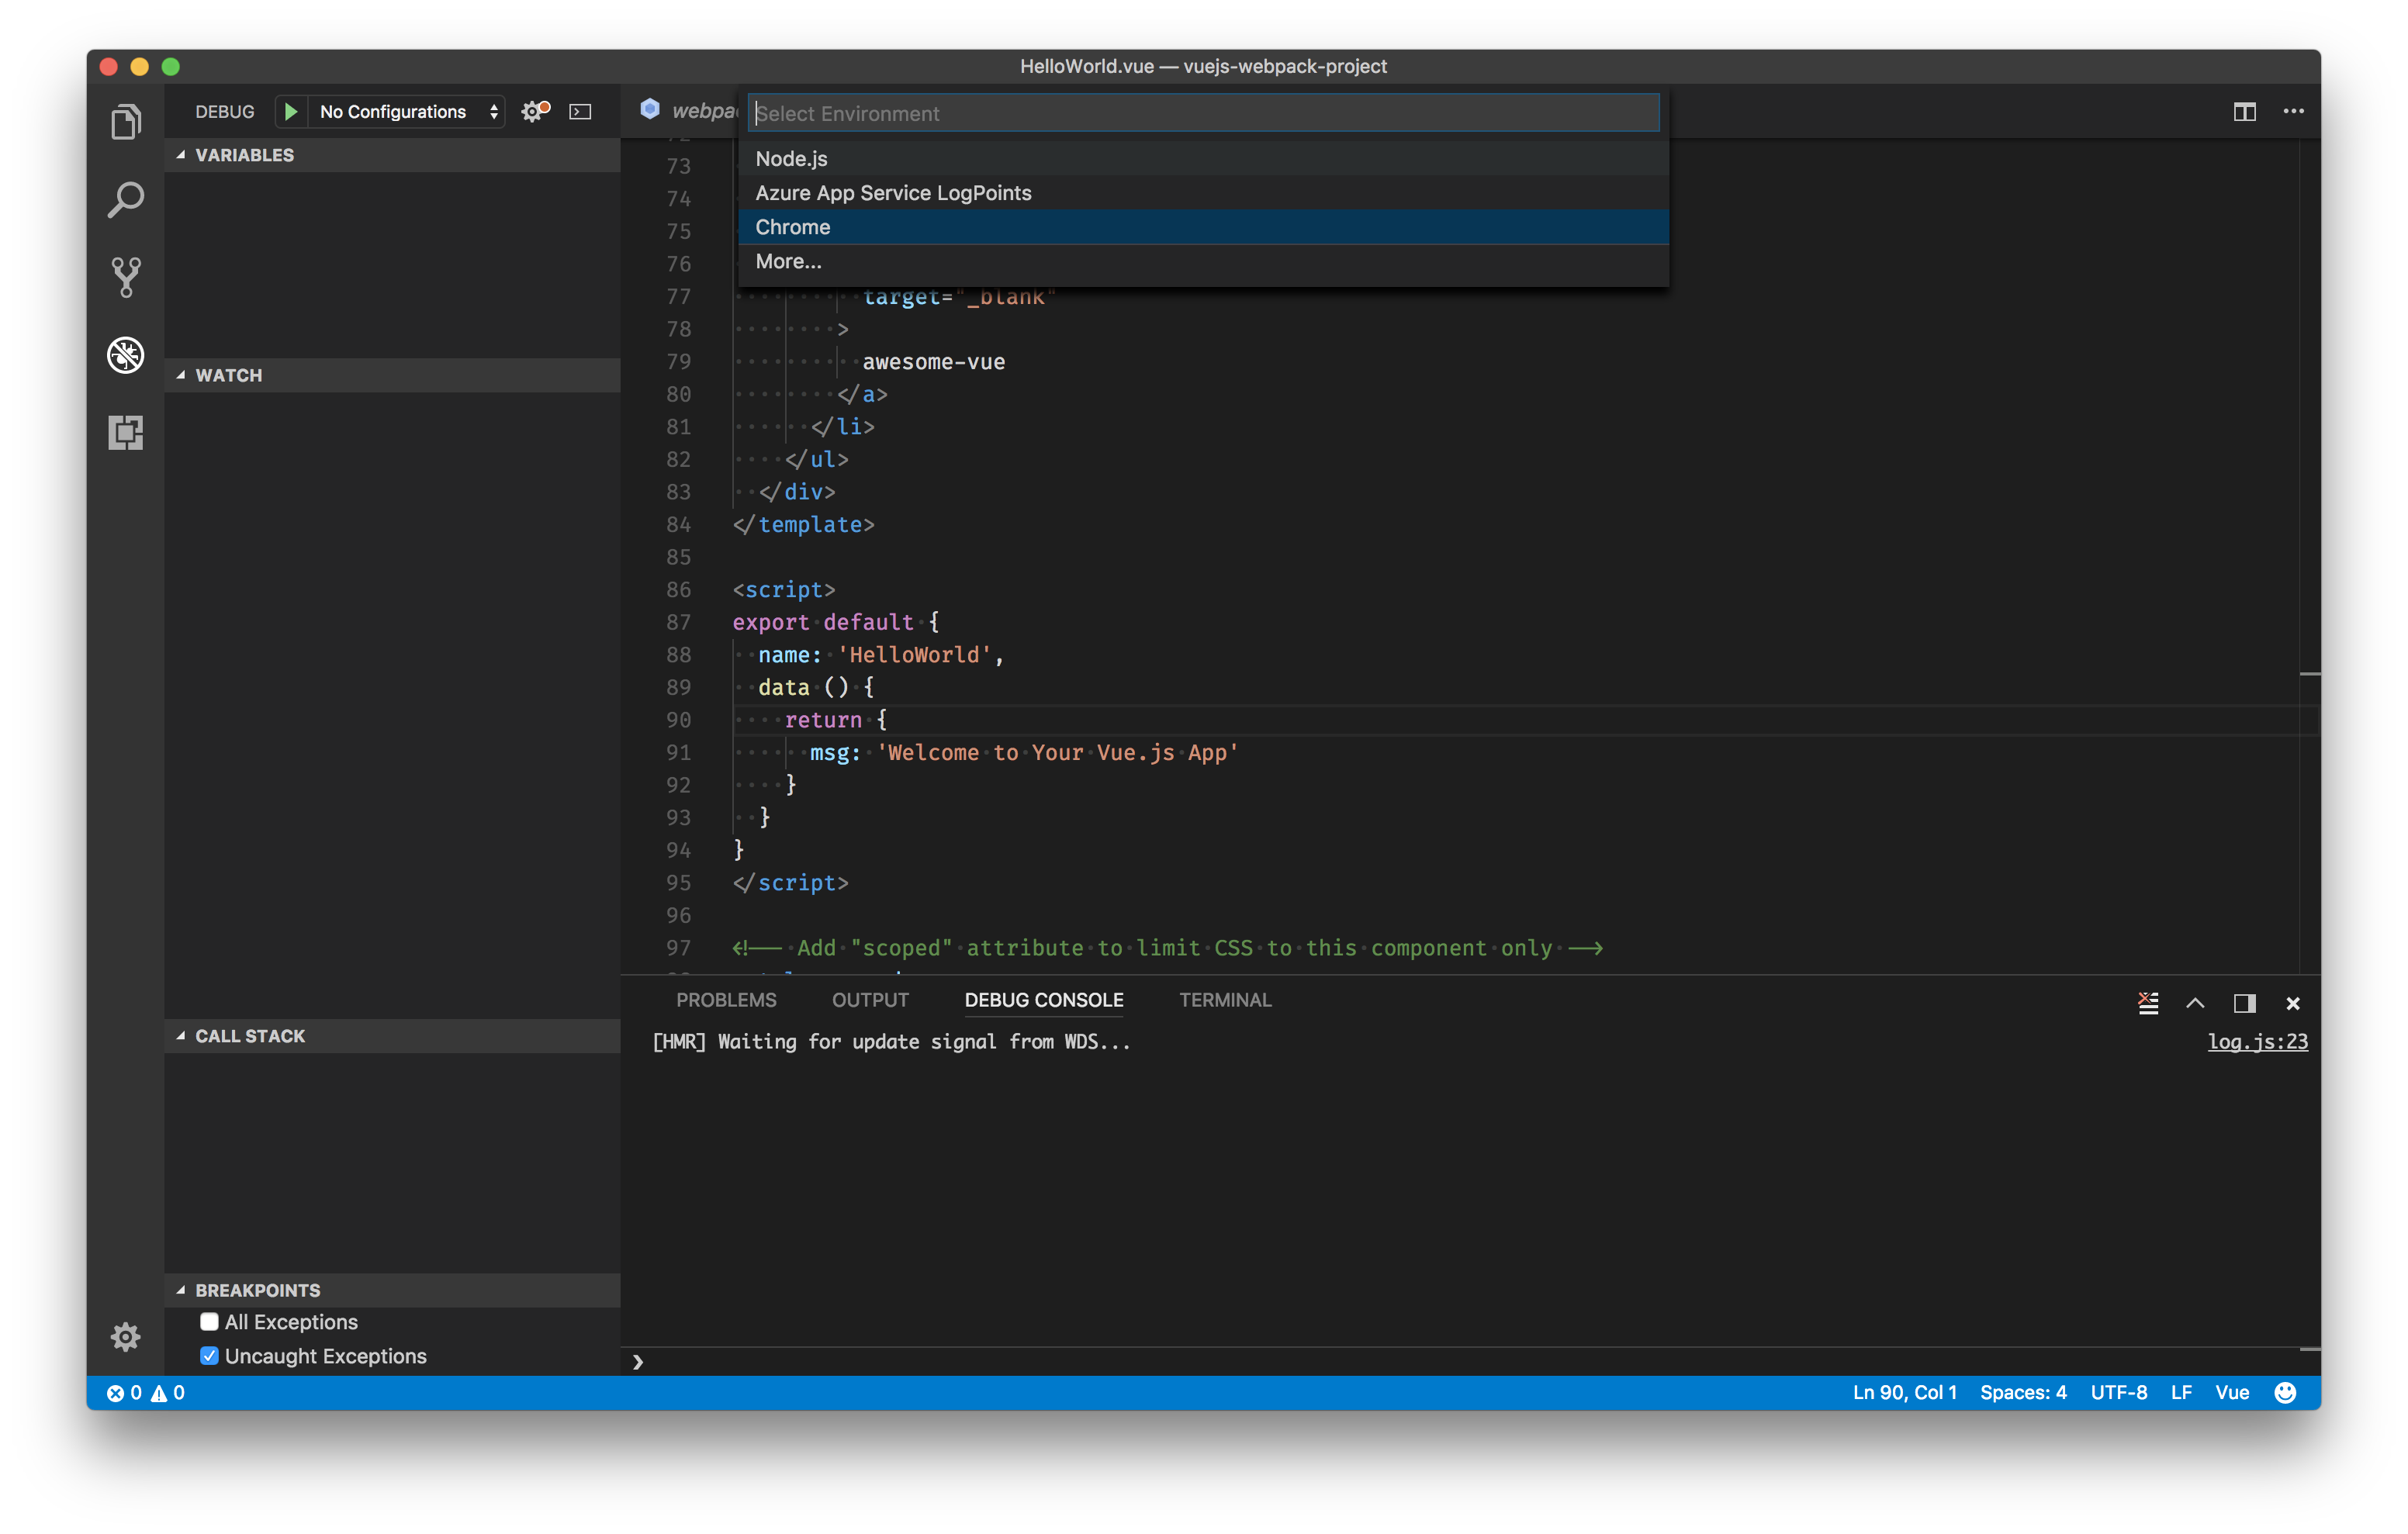
Click on the Debugging icon in the Activity Bar to bring up the Debug view, then click on the gear icon to configure a launch.json file, selecting Chrome/Firefox: Launch as the environment. Replace content of the generated launch.json with the corresponding configuration:
|
Setting a Breakpoint
Set a breakpoint in src/components/HelloWorld.vue on
line 90where thedatafunction returns a string.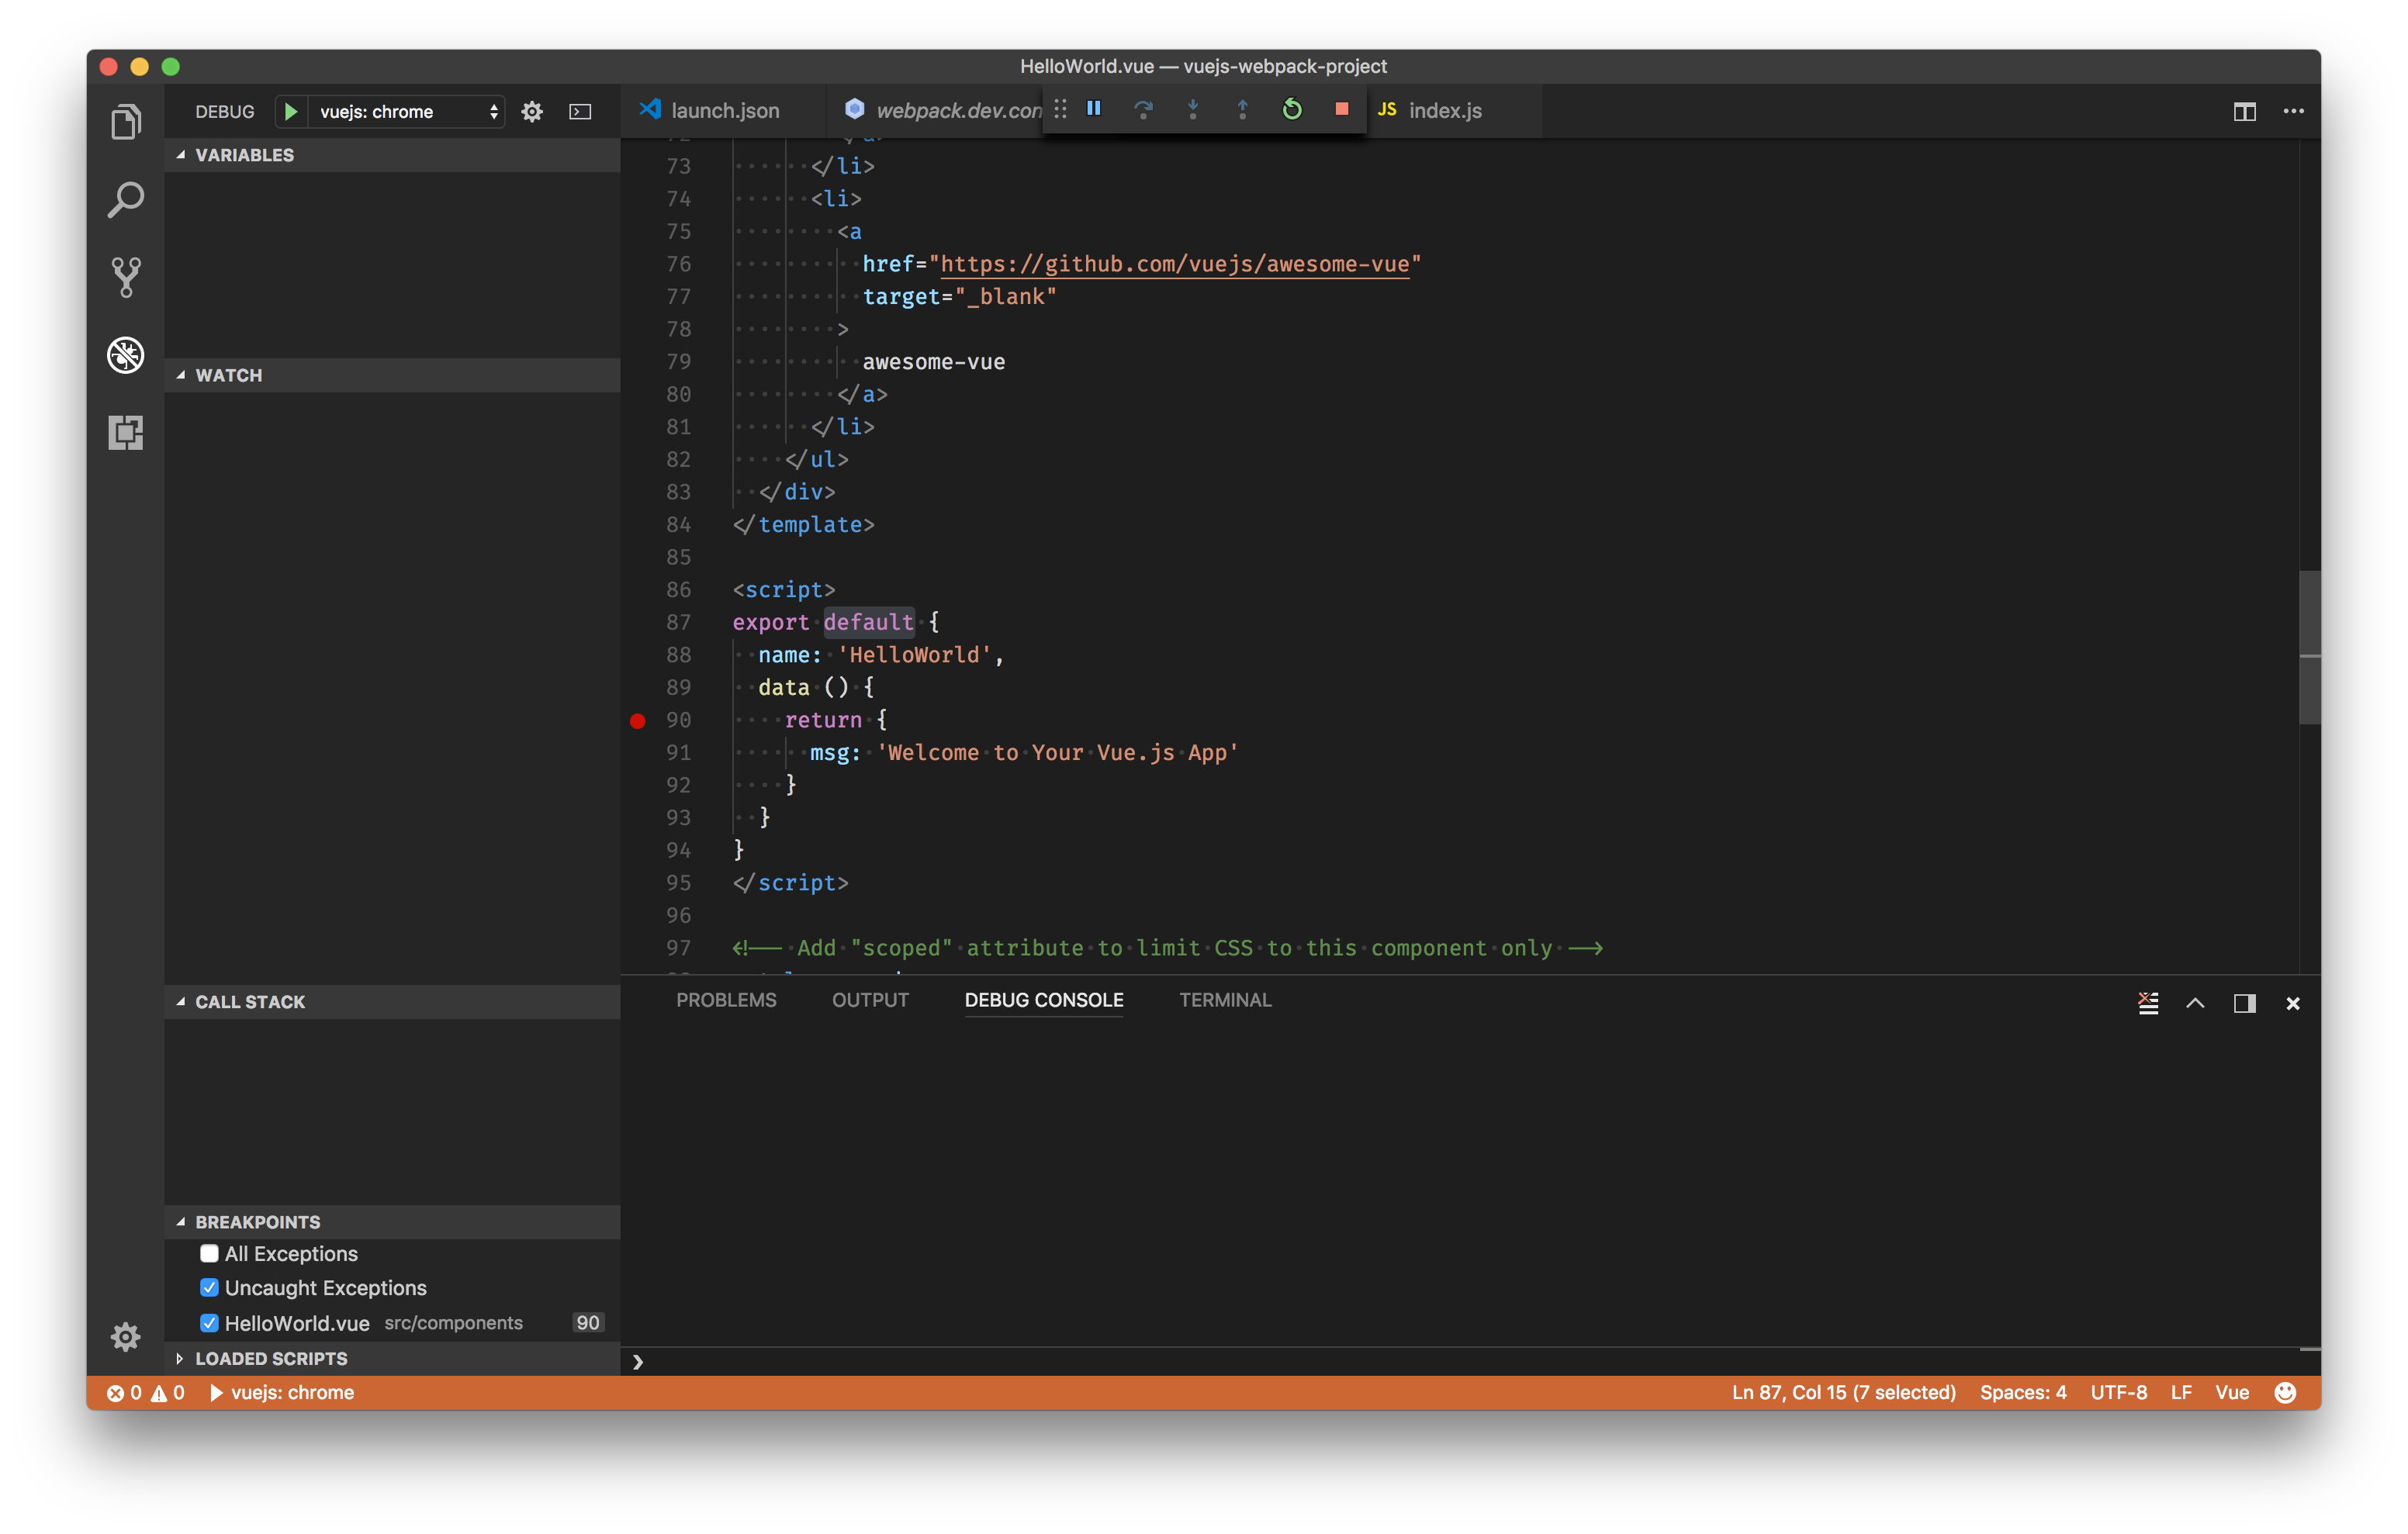
Open your favorite terminal at the root folder and serve the app using Vue CLI:
npm run serveGo to the Debug view, select the ‘vuejs: chrome/firefox’ configuration, then press F5 or click the green play button.
Your breakpoint should now be hit as a new browser instance opens
http://localhost:8080.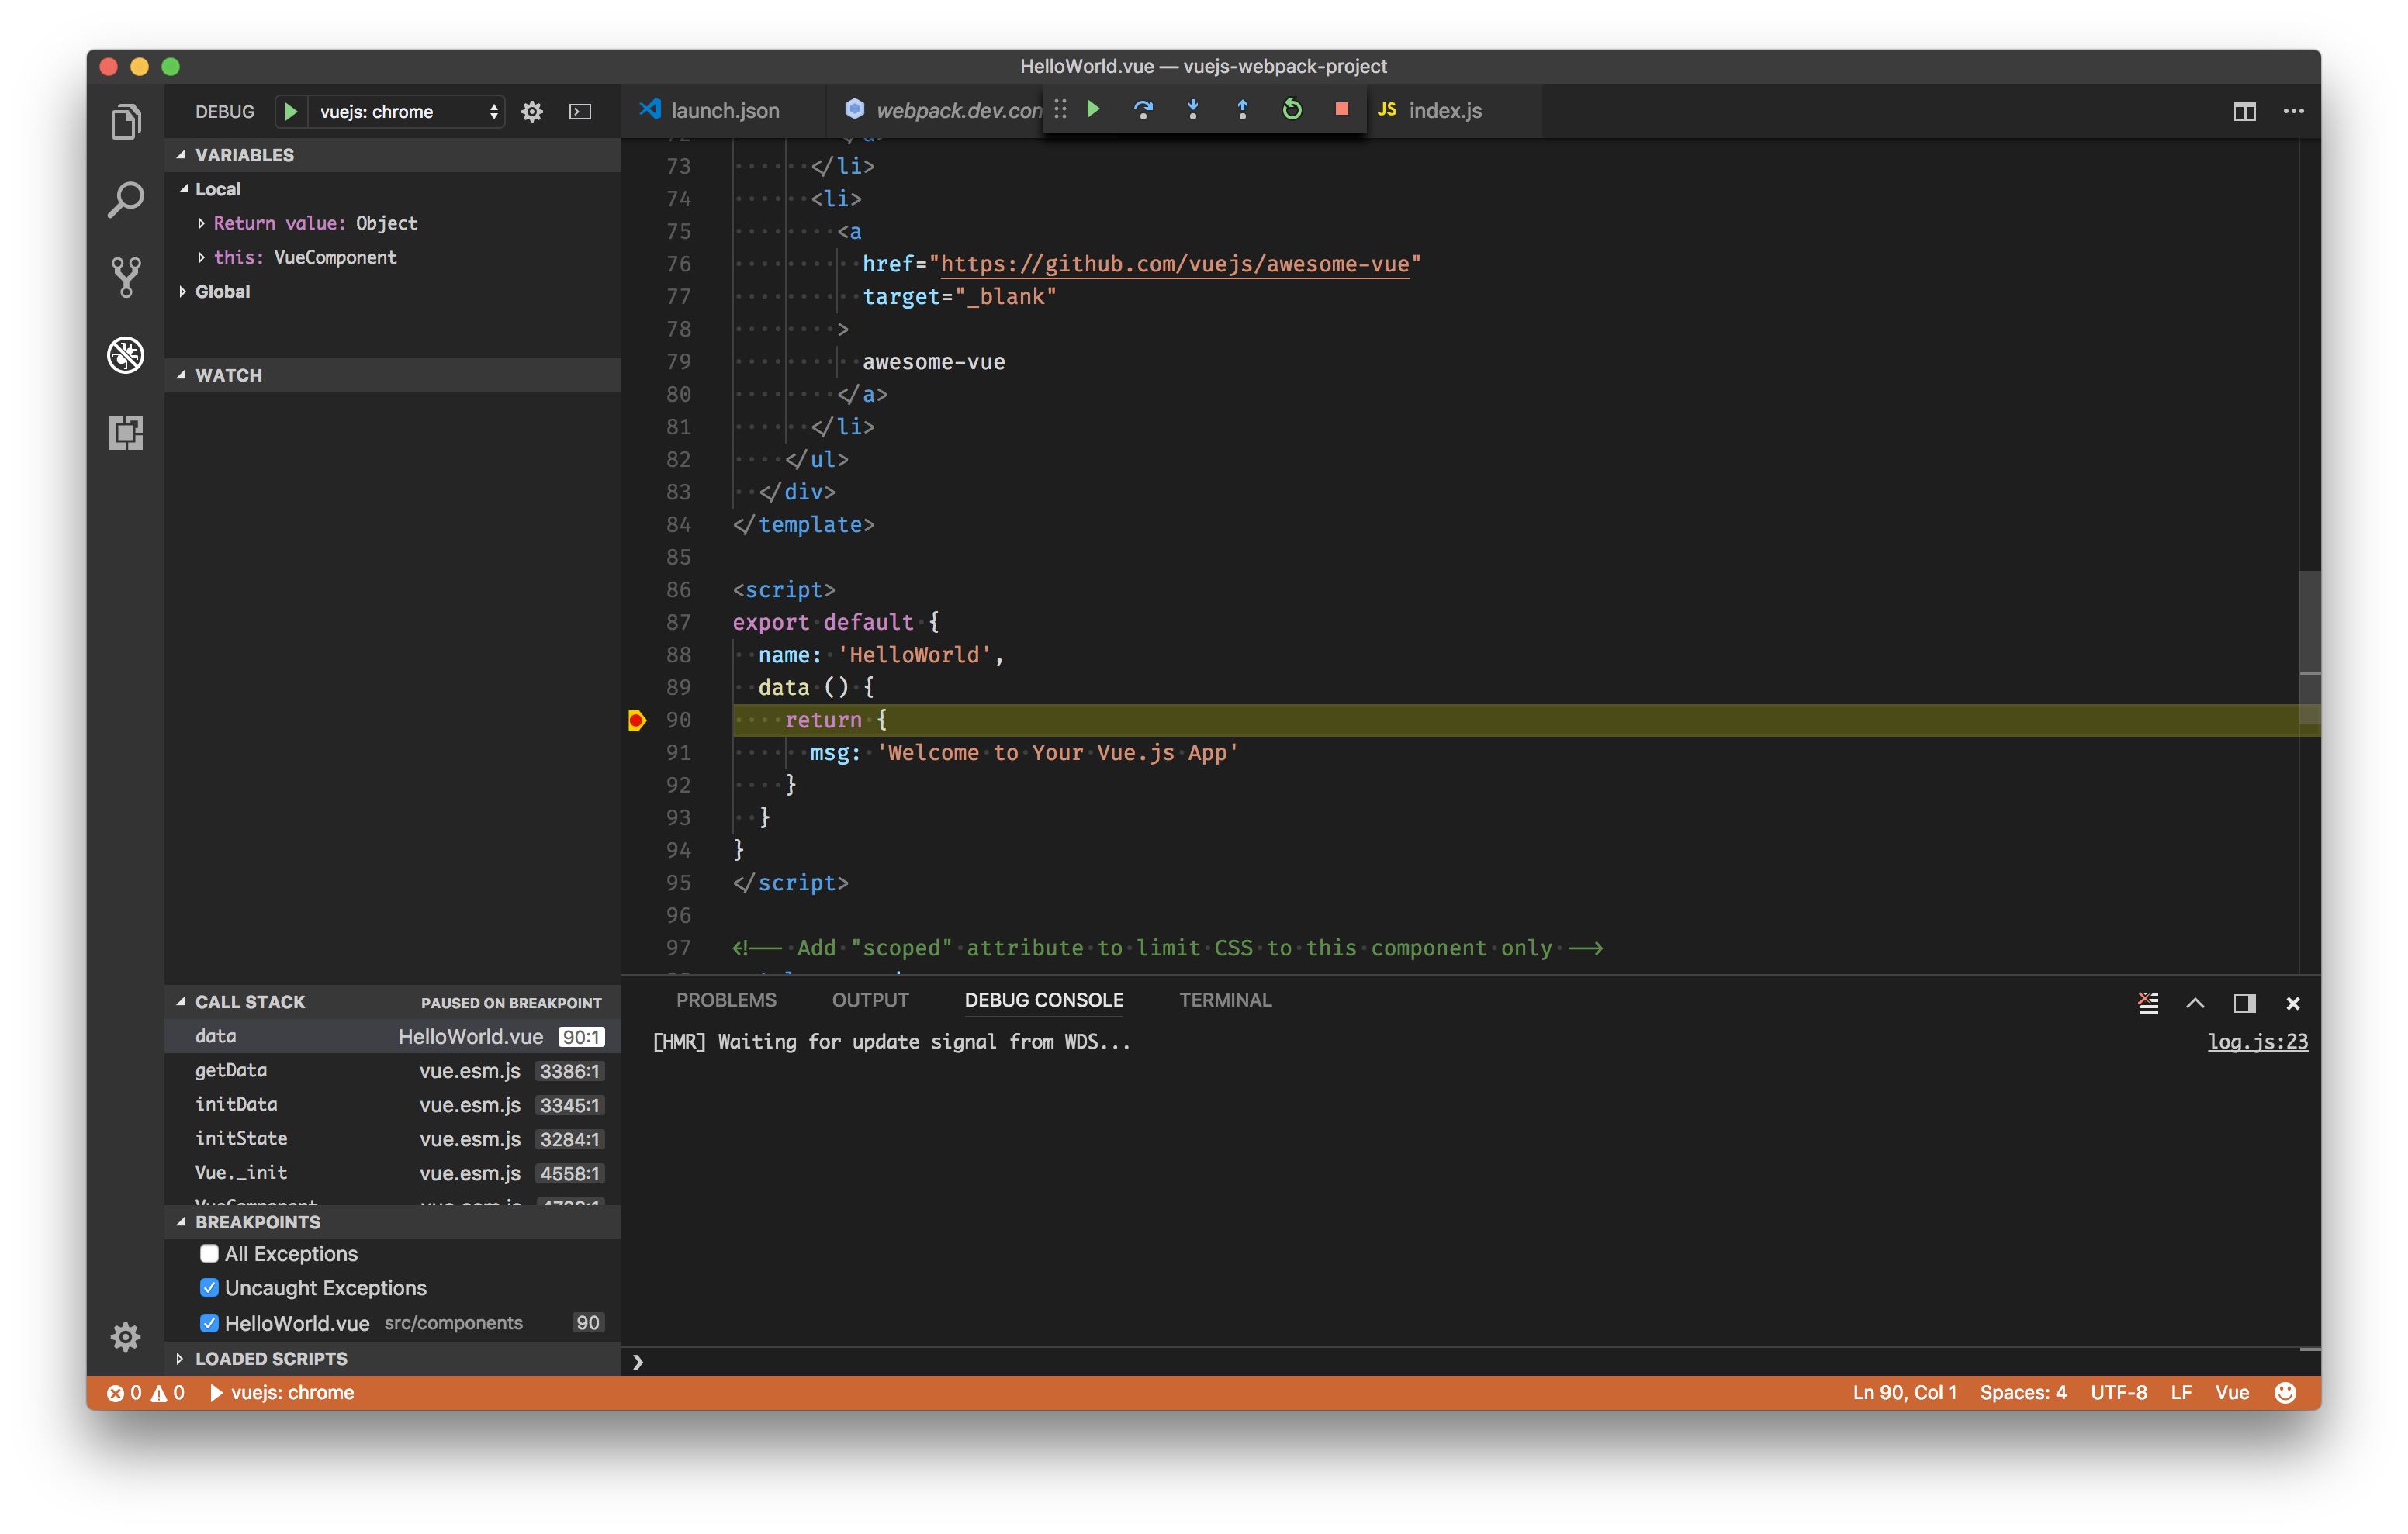
Alternative Patterns
Vue Devtools
There are other methods of debugging, varying in complexity. The most popular and simple of which is to use the excellent Vue.js devtools for Chrome and for Firefox. Some of the benefits of working with the devtools are that they enable you to live-edit data properties and see the changes reflected immediately. The other major benefit is the ability to do time travel debugging for Vuex.
Please note that if the page uses a production/minified build of Vue.js (such as the standard link from a CDN), devtools inspection is disabled by default so the Vue pane won’t show up. If you switch to an unminified version, you may have to give the page a hard refresh to see them.
Simple Debugger Statement
The example above has a great workflow. However, there is an alternative option where you can use the native debugger statement directly in your code. If you choose to work this way, it’s important that you remember to remove the statements when you’re done.
|
Acknowledgements
This recipe was based on a contribution from Kenneth Auchenberg, available here.